Research and academic profile ↗
Author’s research website
Scope and access record
First-person research profile
University of Virginia affiliation and nonequilibrium statistical-physics research interests.
Marija Vucelja’s work asks how a system’s preparation changes its route to equilibrium. Build the probability picture, watch the modes, and test the result.
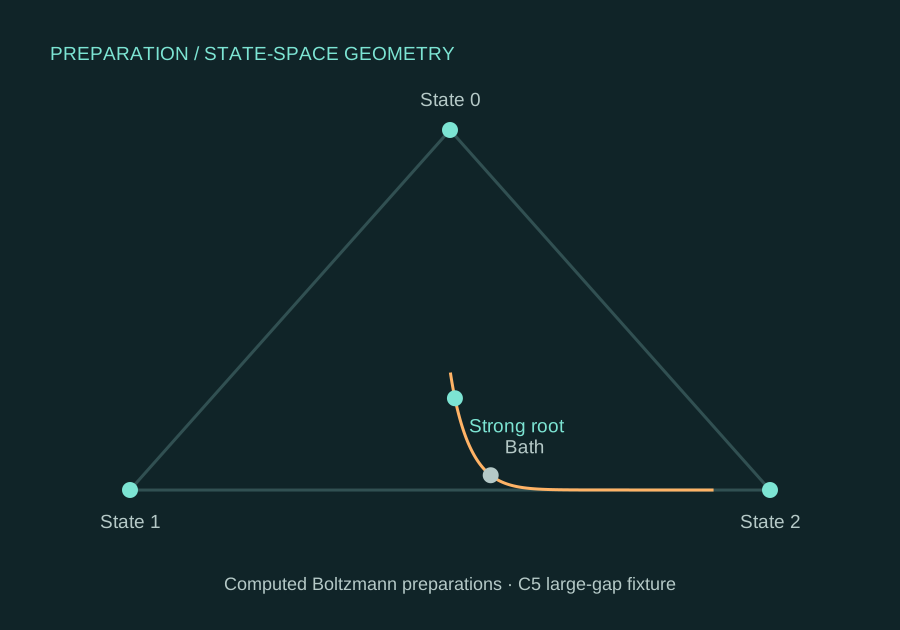
A starting temperature tells you how a system was prepared. It does not, by itself, describe every stage of its return to equilibrium.
Imagine repeatedly preparing one tiny system with three possible states. Record the fraction of repetitions found in each state: that gives three probabilities. The probabilities can change while the allowed states and the surrounding bath stay the same. This is the language of our illustration.
Vucelja and her coauthors use statistical physics to investigate anomalous relaxation. The relevant connection here is slow-mode cancellation in a specified Markovian model. The geometric picture below is our own calculation, built to make that idea inspectable.
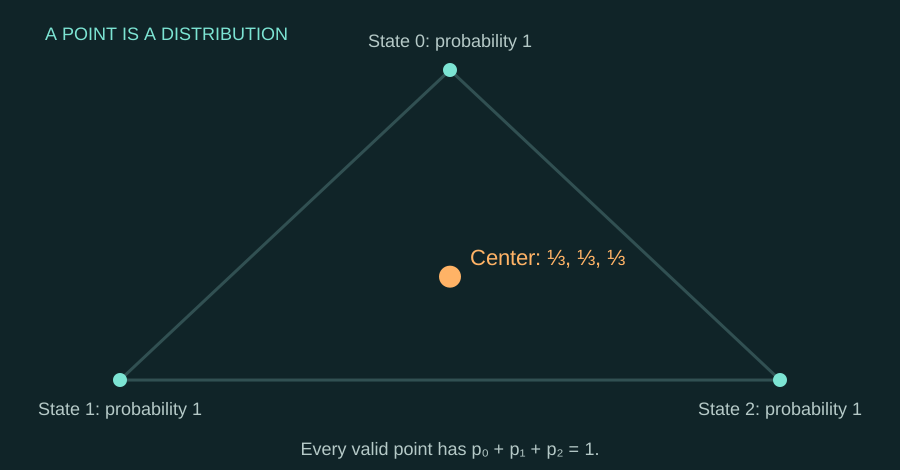
A point at State 0 means probability one in State 0. At the center, all three probabilities are one third. Moving a point changes the probabilities, not an object’s physical position.
p₀ = 0.333333
p₁ = 0.333333
p₂ = 0.333333
The triangle is probability space. Coordinates are calculated from the C5 state probabilities; line lengths on this drawing are not L1 distances or distances through physical space. The bath marker is the common equilibrium.
Three probabilities might seem to need three coordinates. But p₀ + p₁ + p₂ = 1 removes one degree of freedom. A flat triangle can therefore hold every possible distribution. Its corners are certainty in one state; its edges set one probability to zero; points inside give positive probabilities to all three states.
For the large-gap C5 fixture, the warm start is approximately (0.120, 0.409, 0.471). The hotter strong-root start is (0.255, 0.365, 0.380). Both approach the same bath distribution, approximately (0.041, 0.416, 0.543). Read the bars beside the triangle: the object represented is a distribution, not a droplet moving across a surface.
The animation uses the saved rate matrix. We change the initial preparation while holding that matrix and the bath fixed. It is a controlled numerical comparison; the points are not experimental observations from Vucelja’s laboratory.
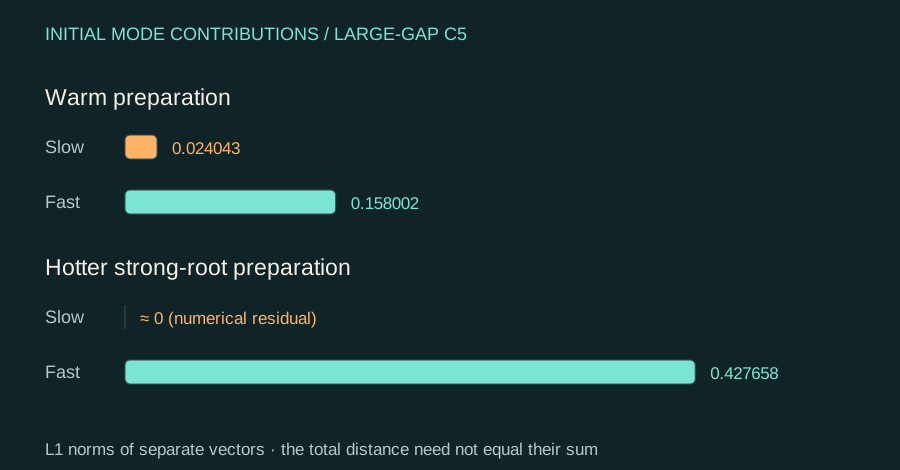
In this three-state model, the departure from equilibrium separates into two vector contributions. Each shrinks exponentially at its own rate. Their initial coefficients depend on the preparation.
The slow contribution has the smaller magnitude rate, |λ₂| = 0.0015912. The other rate is |λ₃| = 0.0115395. For an ordinary preparation, the fast contribution eventually becomes small enough that the slower one governs the late tail. At the special strong-root preparation, the slow contribution vanishes in the model. The fast decay remains.
At ε = 0.001, the strong-root start arrives at 525.008 model units and the warm start at 1,998.331. At the looser ε = 0.1, warm arrives at 39.014 and strong-root at 125.929. The same generator, preparations and decay rates produce both orderings. The operational question includes the threshold.
This is why the Atlas reports a mode criterion and an arrival criterion together. Changing the threshold is a legitimate exploratory question; a confirmatory comparison must declare the relevant threshold before looking for a winning result.
Marija Vucelja is an associate professor of physics at the University of Virginia, with a mathematics affiliation. Her research spans nonequilibrium statistical physics and anomalous thermal relaxation. Here we focus on work that helps us ask a precise question: which preparation changes the route back to equilibrium? Vucelja’s research website ↗
“Using statistics and probability, we can see the forest for the trees”Marija Vucelja, quoted by Fariss Samarrai in UVA Today, 21 May 2020. Read the original profile ↗
| Work | Contribution | How we use it |
|---|---|---|
| Klich, Raz, Hirschberg & Vucelja · PRX 2019 | Strong Mpemba relaxation and the geometry of slow-mode cancellation. | A theoretical basis for a clearly identified, separate three-state illustration. |
| Klich & Vucelja · 2019 preprint | An exact result for specified complete-graph Metropolis dynamics. | A narrowly defined negative control, rather than a claim about every complete graph. |
| Teza, Bechhoefer, Lasanta, Raz & Vucelja · 2026 review | Definitions, experimental systems and routes to applications. | A guide to distinguishing distance measures, model classes and experiments. |
| Klich & Vucelja · J. Phys. A 2026 | Related near-complete-graph / independence Metropolis–Hastings publication. | Title and publication metadata confirmed. Full-text extensions are not reproduced here. |
| Vucelja & Fouxon · JFM 2007 | Weak compressibility of liquid-surface wave turbulence. | An explicit limit on transferring surface-wave clustering into an airborne-fog claim. |
The downloadable C5 records were generated for Waveform Atlas’s research review. They are not a dataset supplied by Vucelja’s group, and they are not measurements of a laboratory cooling apparatus. The papers are credited for the relevant theory; our code, fixtures and limitations have their own provenance.
Two selected three-state chains expose the practical distinction. At L1 distance 0.001, the strong-root preparation arrives earlier than the warm preparation in the large-gap example, but later in the small-gap example. Both have a preparation that removes the slow mode. The starting amplitudes and the chosen finish line still matter.
For a specified physical system, can its measured relaxation modes and accessible preparations support a repeatable improvement at a declared operational threshold? Answering that requires an actual system model, calibrated observations and preparation costs. The theoretical possibility is valuable; the transfer remains to be tested.
The Atlas keeps this thread alongside its damping investigation, compression chapter and measurement methods.
Published work, author attribution and the limits relevant to this chapter. Atlas examples and calculations are labeled separately.
Author’s research website
First-person research profile
University of Virginia affiliation and nonequilibrium statistical-physics research interests.