Choose the system before calling energy lost
Imagine sending a short acoustic pulse into a small enclosure. A microphone inside records a strong signal followed by a weaker one. Three different accounting choices are possible: the pressure at the microphone, the acoustic field throughout the enclosure, or the enclosure together with its walls and the surrounding air. Energy can leave the first description while remaining in the second, or leave the second while remaining in the third. The observation alone does not select the boundary.
A useful experiment therefore names both its measured variable and its control volume. Pressure, displacement, electric field and detector counts are different variables with different relations to energy. A field amplitude can decrease because the wave spreads over a wider area, because its polarization rotates away from the detector, or because destructive interference changes the local field. None of those explanations requires the same thermal response as an absorbing wall. The first question is consequently precise: which mode, region or measurement channel is becoming smaller?
Absorption puts the receiving system into the ledger
An absorbing material responds to the applied disturbance. Charges move in an electromagnetic field; molecular and structural degrees of freedom respond to sound; an electronic transition can receive a photon. The incident wave and the receiver exchange energy. A material may subsequently distribute that energy among many microscopic degrees of freedom, emit radiation, produce an electrical signal or undergo a chemical transformation.
Absorption is therefore a transfer stage, not necessarily the final thermal destination. A solar cell and a black coating can both absorb optical energy while delivering very different useful outputs. In a fluorescence experiment, absorbed light is partly followed by light at another frequency. If the experiment measures only the original beam, that later radiation can be missed. A complete description identifies the absorbing transition or material response and then follows the subsequent relaxation channels. Calling every reduction of transmitted light absorption skips this essential identification step and can overestimate material heating.
Damping belongs to a specified motion
For a mechanical coordinate x, a common model is m ẍ + b ẋ + kx = 0. The term proportional to velocity removes energy from that coordinate when b is positive. Multiplying the equation by ẋ gives dE/dt = −b ẋ² for E = m ẋ²/2 + kx²/2. The negative sign is an exact result for this idealized model, not a statement that the combined system violates energy conservation.
The destination is represented implicitly by the damping term. It may stand for air drag, internal material losses, an attached electrical load or radiation into other mechanical modes. Measuring b therefore characterizes the observed coordinate's coupling to its surroundings, but does not identify every microscopic mechanism. A more detailed model can replace the single term with explicit coupled coordinates. What looked like loss from one oscillator can then appear as increasing energy in another oscillator or an outgoing continuum of waves.
Leakage is an output channel
A resonator can ring down because its boundaries transmit energy. An optical cavity with partially transmitting mirrors releases a measurable light pulse after its external drive stops. A mechanical resonator attached to a support can radiate elastic waves into that support. These are leakage channels even if little energy is absorbed inside the resonator itself.
This distinction is useful in design. Increasing the output coupling can shorten a cavity lifetime while increasing the fraction of stored energy delivered to a desired detector. Conversely, sealing an output port can lengthen the lifetime without improving the material's intrinsic absorption. The measured decay rate usually combines several processes. For independent linear channels, one can write κ = κout + κabs + κother. A single lifetime determines their sum. Separating the terms requires additional measurements, such as calibrated output power, mirror transmission, temperature rise or a controlled change in the coupling geometry.
A small numerical energy budget
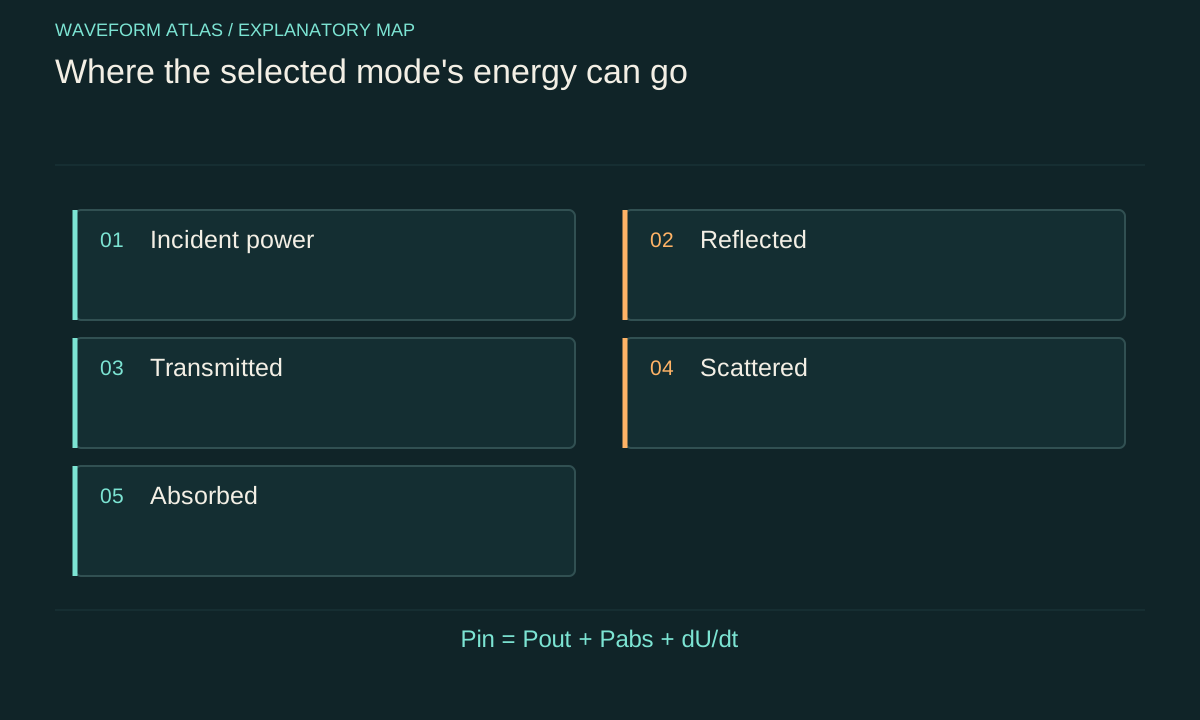
Consider an illustrative optical sample illuminated by 1.00 mW in a steady state. Suppose calibrated measurements find 0.20 mW reflected, 0.50 mW transmitted into the original beam and 0.10 mW scattered into other directions. The remaining 0.20 mW is a candidate absorbed power only after checking that there are no unmeasured optical ports, frequency-shifted emission or continuing accumulation of stored energy.
The arithmetic is simple, but its conditions matter. A detector that collects only a narrow forward cone would report 0.50 mW transmission and could incorrectly label the missing 0.50 mW as absorption. Collecting reflected and diffuse radiation changes the conclusion. During a transient, the balance instead includes dU/dt, the rate of change of energy stored in the sample and nearby fields. Heat measurements can help close the budget, although they introduce their own thermal conductance, heat-capacity and time-response corrections. These numbers illustrate an accounting method; they are not a measurement of a particular material.
Amplitude and energy need different scales
For many linear waves in a fixed medium, an appropriate time-averaged energy or intensity is proportional to the square of the amplitude. If an amplitude envelope falls as exp(−γt), its associated energy envelope falls as exp(−2γt). Mixing those conventions creates a factor-of-two error in a reported lifetime or damping rate.
The proportionality also depends on what remains fixed. A voltage measured across a changing impedance is not automatically a reliable proxy for delivered power. A displacement measured at one point may not represent the energy of a changing mode shape. In an optical experiment, a detector's spectral sensitivity can change when a converter shifts the wavelength. Good reports state whether a plotted ordinate is field amplitude, squared amplitude, intensity, energy or a detector signal proportional to one of these. They also specify the calibration converting the instrument's output into that physical quantity.
Coherence is a separate measurement
A reduction in energy and a reduction in coherence can occur together, but neither observation determines the other. An interferometer measures phase relationships by recombining alternatives. A calorimeter measures transferred energy. A population measurement counts excitations in specified levels. These instruments answer related but distinct questions.
For example, random phase shifts can wash out an interference fringe while leaving the average energy of each realization almost unchanged. Conversely, an ideal optical attenuator can reduce the mean amplitude of a coherent state while preserving a coherent-state form in the transmitted mode. Other input states become mixed when unobserved loss channels carry information away. The correct claim depends on both the initial state and the channel. A useful damping study measures a relevant coherence observable when coherence matters, instead of inferring it from a smooth decline in a time trace.
What would distinguish the explanations?
Start with several competing models that predict the observed decrease. A spreading model changes the spatial distribution; a scattering model predicts power in new directions; an absorption model predicts excitation or heating in the receiving material; a dephasing model predicts reduced interference visibility. Then choose measurements that respond differently to those predictions.
Moving the detector, changing its collection angle, rotating a polarization analyzer, scanning wavelength and monitoring temperature can each reveal a different missing channel. Altering a boundary tests leakage. Repeating the measurement at controlled temperature can help identify an internal loss mechanism. The strongest experiment combines these observations with calibrated uncertainty and checks whether one parameter set explains them all. The result is more informative than saying that a wave vanished: it identifies a transfer pathway, its rate, the energy retained elsewhere and the conditions under which the description remains valid.
Frequency and direction belong in the definition
Absorption is usually frequency dependent. A material that accepts energy efficiently in one band can be reflective or nearly transparent in another. Its response can also depend on polarization, propagation direction, temperature and the strength of the incident field. A single percentage without these conditions is therefore an incomplete description of an absorber.
For a narrowband experiment, report the center frequency and the bandwidth of the source and detector. For a pulse, compare the incident and outgoing spectra rather than only their total energies. A shifted spectrum may reveal fluorescence or nonlinear conversion; a changed angular pattern can reveal scattering. These measurements also explain why apparently conflicting experiments may both be correct: they can illuminate the same sample in different modes or count different outgoing channels. An absorption coefficient is a property of a specified response regime, not a promise that every possible wave encounters the same fate.
Reversibility depends on how much of the environment is controlled
Transfer into another well-defined mode can sometimes be reversed. Two coupled oscillators exchange energy periodically in an ideal lossless model, even though one oscillator becomes quiet during part of the exchange. Transfer into a large number of uncontrolled degrees of freedom is much harder to reverse operationally because their phases and correlations are not tracked.
This difference explains why microscopic conservation and practical irreversibility coexist. A damped coordinate can lose a recoverable phase relation from an experimenter's perspective without the combined system losing energy. An attempted reversal must specify which environmental variables are manipulated and which are ignored. A local recovery experiment, a thermal measurement and a reconstruction of a quantum state can therefore provide different evidence about the same interaction. The useful conclusion is tied to the actual control available, rather than to the visual impression of a shrinking wave.
What to take forward
- Define the measured mode and control volume before interpreting a decrease.
- A lifetime measures total loss from a mode, not automatically material absorption.
- Energy, population and phase coherence require separate observables.
Go to the original work.
These links identify the sources behind specific claims. Verification scope varies by source and is stated below.
- 1 / University teachingElectromagnetics and Applications — lecture notes ↗
David H. Staelin. Electromagnetics and Applications — lecture notes. 2009.
Poynting theorem, boundary conditions, material response and polarization
Verification scope: Official author-written course and topic records inspected
- 2 / University teachingElectromagnetics and Applications, Chapter 9: Electromagnetic Waves ↗
David H. Staelin. Electromagnetics and Applications, Chapter 9: Electromagnetic Waves. 2009.
Planar boundaries, complex media, waveguides and cavity resonators; §9.4 defines Q through energy loss and exponential decay.
Verification scope: Current official PDF download verified; relevant chapter passages inspected, not an entire textbook reread.
- 3 / Primary researchTime-resolved scattering of a single photon by a single atom ↗
V. Leong; M. A. Seidler; M. Steiner; A. Cerè; C. Kurtsiefer. Nature Communications 7, 13716 (2016).
Time-dependent single-atom excitation for rising and decaying exponential single-photon envelopes; the reported 56(11)% peak-excitation increase, not an increase in total scattering.
Verification scope: Publisher bibliographic record and abstract inspected; full article not reread in this repair
- 4 / University teachingDamped Oscillations — University Physics Volume 1 ↗
OpenStax. University Physics Volume 1, Section 15.5: Damped Oscillations.
Linear viscous damping and damping regimes
Verification scope: Official textbook section and equation record inspected
- 5 / Primary researchCavity ring-down spectrometer for high-fidelity molecular absorption measurements ↗
H. Lin; Z. D. Reed; V. T. Sironneau; J. T. Hodges. Journal of Quantitative Spectroscopy and Radiative Transfer 161, 11–20 (2015).
DOI: 10.1016/j.jqsrt.2015.03.026
Exponential cavity decay fitting, baseline offsets and a loss budget separating mirror loss, etaloning, scattering and absorption.
Verification scope: NIST-hosted full text: title page and relevant decay-fit/loss-budget passages inspected; not every section reread.
- 6 / University teachingOscillations: Key Equations — University Physics Volume 1 ↗
Oscillations: Key Equations — University Physics Volume 1.
Oscillator equations and amplitude/frequency conventions
Verification scope: Official equation page inspected
- 7 / University teachingQuantum Optical Communication — Jeffrey H. Shapiro, readings and lecture slides ↗
Jeffrey H. Shapiro. Quantum Optical Communication — Jeffrey H. Shapiro, readings and lecture slides. 2016.
Author-written quantum attenuator, amplifier, detection and parametric interaction framework
Verification scope: Official course materials and topic mapping inspected
Found a problem with a claim or calculation? Send the page, the claim and the evidence. Read how these articles were prepared.