Choose the useful output before calculating a percentage
Conversion efficiency is a ratio, so it is meaningful only after both its numerator and denominator are defined. The numerator might be power in a particular spatial mode, photons in a target frequency band, or energy in a selected acoustic polarization. Total transmitted intensity is not automatically the useful converted output.
Specify the accepted bandwidth, polarization, spatial profile, arrival-time window, and propagation direction. A broad detector may count light outside the mode that the next component can use. Conversely, a narrow analyzer may reject correctly converted light because it is misaligned. These possibilities affect interpretation in opposite ways.
The denominator needs an equally concrete boundary. Power launched toward a chip, power actually coupled into its guide, and power reaching its active region are different quantities. A useful report draws those reference planes or describes them unambiguously. Without this information, a percentage can change substantially through a bookkeeping choice while the physical device remains identical.
Internal and external efficiencies form a measurable chain
Let the input coupling transmit a fraction T_in into the active region, the region convert a fraction η_int into the desired internal mode, and the output path transmit a fraction T_out. If these stages act independently on the same defined mode and normalization, the external efficiency is η_ext = T_in η_int T_out.
For an illustrative chain with T_in = 0.80, η_int = 0.75, and T_out = 0.70, the result is 0.42. A seventy-five percent internal conversion claim is compatible with only forty-two percent of the externally supplied signal reaching the usable output. Neither figure is wrong when its reference planes are explicit.
The product model can fail if a stage changes the distribution presented to the next stage. A spatially selective filter, a wavelength-dependent coupler, or pump-dependent loss may require integration over modes instead. Measure those dependencies rather than treating every independently quoted best-case transmission as though it occurred simultaneously.
Power and photon ratios differ when frequency changes
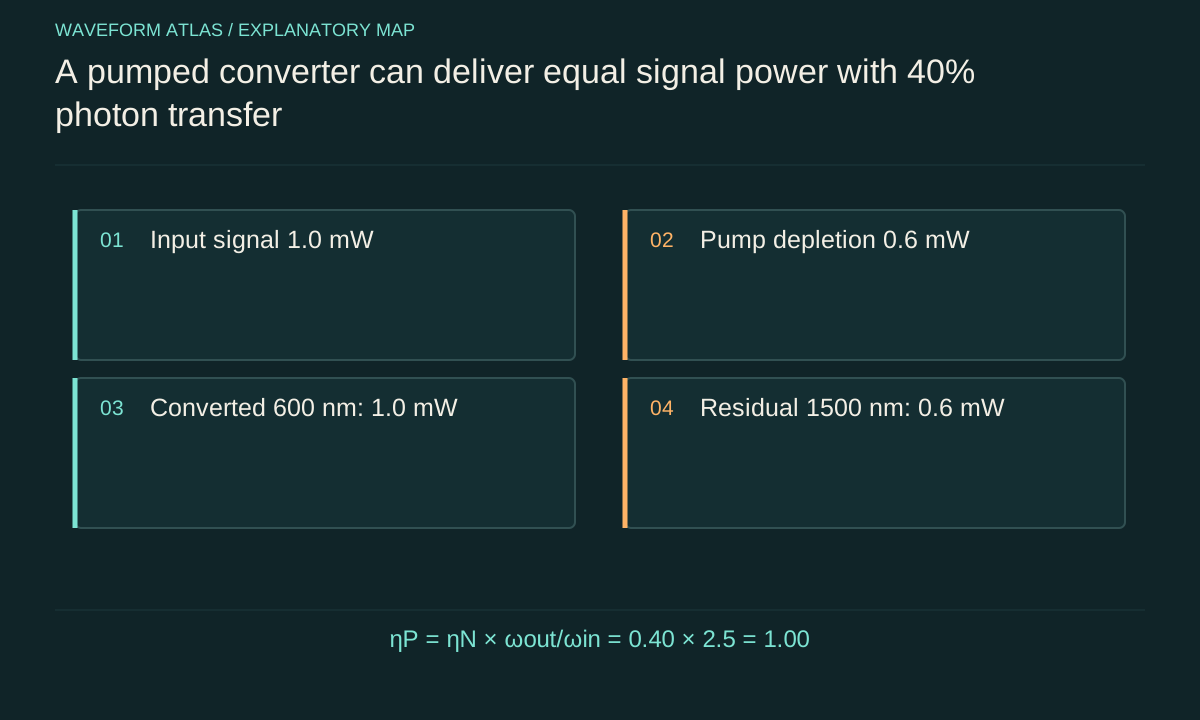
For narrowband light, photon flux is Φ = P/(ℏω). Define a signal photon conversion efficiency η_N = Φ_out/Φ_in for the specified target process. Then the signal power ratio is η_P = P_out/P_in = η_N ω_out/ω_in. This relation simply accounts for the energy carried by each photon.
If vacuum wavelengths change from 1500 nm to 600 nm, the output frequency is 2.5 times the input frequency. Converting forty percent of input photons gives η_N = 0.40 but η_P = 1.00. Equal input and output signal powers therefore do not imply that every photon was transferred.
Conversely, an ideal one-to-one downconverter produces lower output signal power even when its photon transfer is perfect. These statements apply to the defined conversion channel. In a parametric amplifier that creates additional signal photons, the relevant photon ratio can exceed one and must be described as gain with its accompanying noise and pump budget.
The pump belongs in the energy ledger
Use the previous upconversion example with one milliwatt of incident signal, ideal mode matching, and no dissipative loss. Forty percent of its photons are converted to photons with 2.5 times the energy. The target output carries one milliwatt, and the unconverted signal carries 0.6 milliwatts. The additional 0.6 milliwatts comes from pump depletion in the ideal three-wave process.
The optical ledger therefore balances 1.0 + 0.6 milliwatts supplied against 1.0 + 0.6 milliwatts leaving in the two signal bands. A large pump beam may provide far more incident power than that small depleted amount. Most of it can simply leave unused; that distinction matters for system efficiency.
If the engineering objective is economical operation, include the pump source's electrical consumption and auxiliary cooling in a separately defined system metric. A photon-transfer ratio describes an optical transformation. It is not a claim that the whole apparatus turns electrical energy into useful output with the same percentage.
Throughput and modal purity can move in opposite directions
Suppose one milliwatt enters a passive spatial converter. The output contains 0.6 milliwatts in the desired pattern and 0.2 milliwatts in other transmitted modes. Total throughput is eighty percent, target-mode efficiency is sixty percent, and target-mode purity among transmitted power is seventy-five percent.
A perfect filter that removes the unwanted 0.2 milliwatts raises the surviving beam's purity to one hundred percent without increasing its useful converted power. If the filter also attenuates the target, external efficiency falls. Calling this operation improved conversion would hide the distinction between creating the desired field and selecting the part already present.
A fair assessment reports the target power relative to the original input as well as its share of the output. For mode multiplexing, repeat this measurement for every prepared input mode and every analyzed output mode. The resulting crosstalk matrix shows whether high performance for one channel comes with failure or leakage in another.
Detection corrections require stated calibration planes
At low optical levels, measured counts must be converted into photon flux using a detection model. In a simple linear regime, a target count rate C contains converted photons detected with efficiency η_d, path transmission T_d, and a background rate B. The inferred photon flux at the output reference plane is (C − B)/(η_d T_d).
That correction assumes the background estimate represents the same operating conditions and that the detector is not saturated or affected by uncorrected dead time. It also assumes the accepted modes are already defined. Dividing a broadband count by a single efficiency can be misleading when the detector response varies strongly across the spectrum.
Keep calibration factors associated with their physical components. Correcting for a downstream test detector can make sense when reporting device output. Correcting away an essential filter or coupling loss may instead convert an external efficiency into an internal one. State both if both answer useful questions.
Uncertainty can dominate near the claimed limit
An efficiency is a ratio of measured quantities, often with subtracted backgrounds and several multiplicative calibrations. Its uncertainty therefore does not come only from photon counting. Input-power calibration, detector responsivity, coupling drift, mode-analyzer alignment, and temporal acceptance can all contribute.
For independent small relative uncertainties, a product or ratio has an approximate relative variance equal to the sum of the contributing relative variances. If three independent factors each have a three percent relative standard uncertainty, their combination already has about √3 × 3 percent, or 5.2 percent, before counting uncertainty is included. Correlated calibration errors require covariance terms rather than this shortcut.
A nominal result slightly above one in a passive same-frequency experiment can indicate uncertainty or an inconsistent reference plane. It should not be interpreted as new energy production. Near unity, report an interval and describe the loss resolution. Subtracting two large uncertain powers is a poor way to establish a very small missing fraction.
Pulses require integrated energy and temporal acceptance
Peak power is not the same quantity as pulse energy. A converter that compresses a pulse can raise its peak while losing energy, whereas temporal spreading can lower the peak with little loss. For a pulsed energy efficiency, integrate power over a stated window and compare equivalent input and output pulses.
If repetition rates differ or a process selects only some pulses, include the selection probability in the external metric. A high efficiency conditioned on a successful trigger describes the selected trials. The average useful output per original trial includes how often that trigger occurs.
Time-dependent conversion can also vary within a pulse because the pump envelope and signal overlap imperfectly. Integrating over the full output may conceal a distorted temporal mode that a memory or interferometer cannot accept. Report temporal-mode overlap or a relevant waveform measurement when preservation of the pulse shape is part of the intended function.
Efficiency, noise, and conditional fidelity are distinct
A converter can faithfully preserve the state of the rare photons that survive while losing most inputs. It can also produce a bright target-band output contaminated by pump-induced noise. State quality, success probability, and background occupancy therefore need separate measurements and separate denominators.
Tanzilli and colleagues' 2005 interface is a historical example of reporting success and conditional quality distinctly: its author abstract describes frequency transfer with a success probability above five percent and a corresponding fidelity above ninety-eight percent for successful events. Those are device-specific reported results, not a universal efficiency-fidelity relation.
For a new experiment, give the raw and corrected background rates, accepted bandwidth and time window, and the state test appropriate to the input. A narrow filter may improve the signal-to-noise ratio while reducing throughput. The useful operating point depends on the application, so record those changes together instead of combining the best value of each metric from incompatible settings.
A comparable result records one complete operating point
A useful benchmark includes input mode and level, pump power and wavelength where relevant, device temperature or tuning, accepted output modes, reference planes, and acquisition procedure. Report efficiencies and uncertainties under those same conditions. The complete description lets another reader understand which quantity would improve by changing the device and which would improve by changing its packaging or detector.
For passive stationary conversion, sum the powers in all outgoing propagating channels and measured absorption to check the budget. For driven frequency conversion, include pump changes and parasitic generated fields. During transients, stored energy also enters the balance; instantaneous outputs need not match simultaneous inputs before storage is considered.
The best efficiency number is the one that predicts useful output for a defined input. Combining it with a full energy account and a relevant coherence or noise test turns a percentage into a physical result that can guide a real design choice.
What to take forward
- Internal transfer, external delivery, throughput, and modal purity use different denominators.
- For narrowband frequency conversion, the power ratio equals photon efficiency times the frequency ratio.
- Report pump supply, noise, state quality, and calibration uncertainty at the same operating point.
Go to the original work.
These links identify the sources behind specific claims. Verification scope varies by source and is stated below.
- 1 / University teachingFranz Kärtner — Classical Electromagnetism and Optics, chapter 2 ↗
Coupled-mode equations, power normalization, polarization and waveplate transformations
Verification scope: Official author PDF selected sections 2.7 and 2.9 equations inspected; not all 159 pages read
- 2 / University teachingQuantum Optical Communication — Jeffrey H. Shapiro, readings and lecture slides ↗
Author-written quantum attenuator, amplifier, detection and parametric interaction framework
Verification scope: Official course materials and topic mapping inspected
- 3 / Primary experimentA photonic quantum information interface — Tanzilli et al. (2005) ↗
An optical up-conversion interface tested preservation of quantum correlations
Verification scope: Author preprint abstract inspected; historical device-specific performance
- 4 / University teachingElectromagnetics and Applications — lecture notes ↗
Poynting theorem, boundary conditions, material response and polarization
Verification scope: Official author-written course and topic records inspected
- 5 / University teachingUltrafast Optics — lecture notes ↗
Pulse amplification and ultrafast optical dynamics
Verification scope: Official course material records inspected
Found a problem with a claim or calculation? Send the page, the claim and the evidence. Read how these articles were prepared.